
How to Integrate Excel Pivot Tables with Salesforce Data for Advanced Analytics
The concept - data is the new oil, often attributed to mathematician Clive Humby, has been a popular analogy for quite some time. But just like crude oil, data must be refined and processed before it becomes truly valuable.
For many organizations, Salesforce serves as the reservoir of this data - storing everything from customer information to sales metrics.
Yet, turning this raw data into actionable insights remains a challenge. Pre-built Salesforce analytics reports can feel restrictive, and manually exporting data into Excel for analysis introduces inefficiencies and risks.
What if there were a way to combine the best of both worlds - Salesforce’s robust data storage and Excel’s Pivot Tables' analytical versatility?
That’s where an Excel Salesforce connector makes all the difference.
Why Integrating Excel with Salesforce Matters
While Salesforce excels in managing data, analyzing it often falls short without advanced tools. Excel’s Pivot Tables are renowned for offering intuitive, multidimensional analysis, but the lack of integration creates several roadblocks:
- Manual effort: Exporting, cleaning, and preparing Salesforce data for analysis is labor-intensive.
- Inconsistent data: Offline spreadsheets result in outdated or siloed information.
- Missed insights: Without live data access, teams struggle to analyze trends or make informed decisions quickly.
A seamless connection between these platforms eliminates these challenges, empowering organizations to derive insights faster and with greater accuracy.
Benefits of Combining Excel Pivot Tables with Salesforce Data
By bridging Excel and Salesforce, businesses can harness the strengths of both tools:
- Live data access: Analyze up-to-date Salesforce data directly in Excel pivot tables.
- Enhanced data visualization: Use Pivot Tables to conduct multidimensional analysis and create meaningful dashboards.
- Improved collaboration: Teams work on consistent data sets, reducing silos and fostering better alignment.
- Operational efficiency: Eliminate repetitive tasks such as data exporting and reformatting.
In fact, an MIT research study comprehensively shows that organizations leveraging real-time analytics are several times more likely to outperform their competitors.
How to Integrate Excel and Salesforce
Step 1 - Select an integration tool
Select a reliable Excel Salesforce connector like Valorx Fusion (more details below) designed to bridge Salesforce and Excel effortlessly.
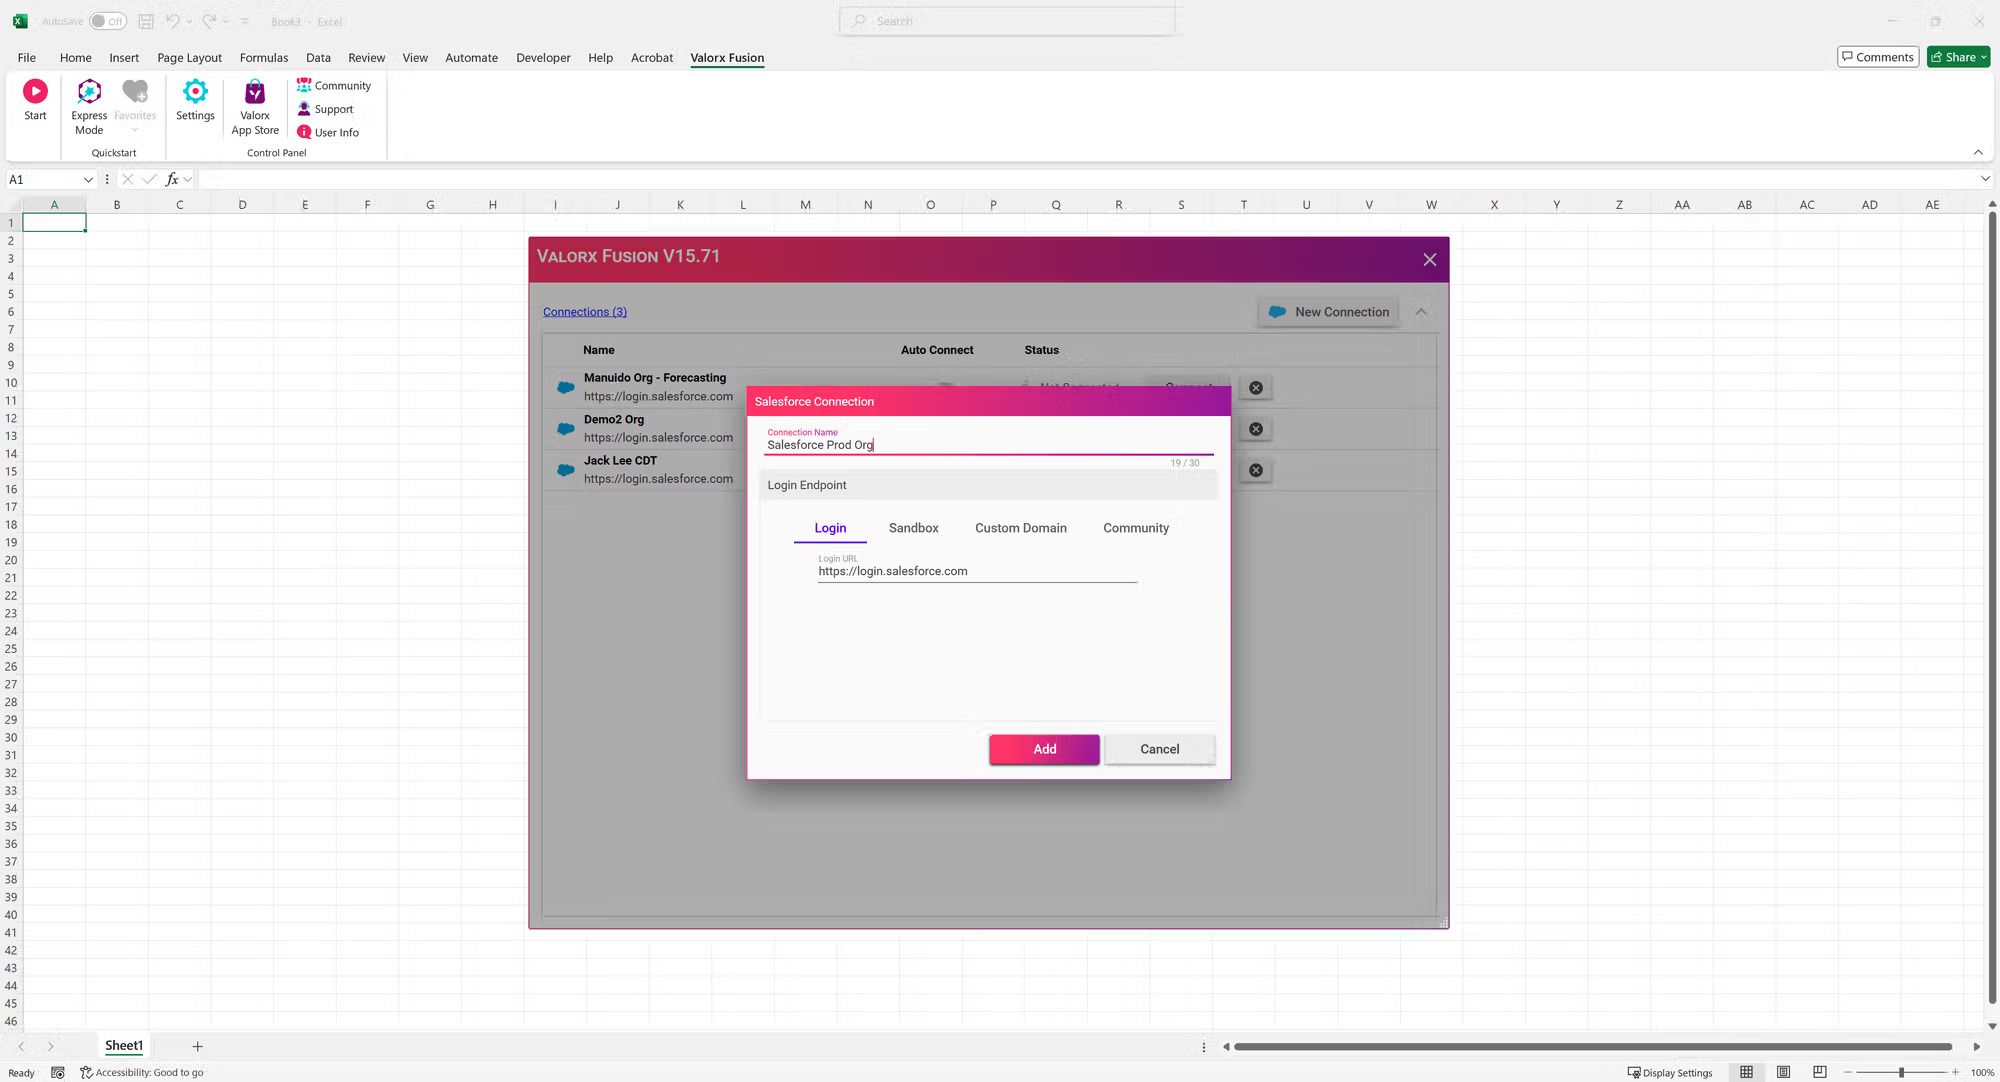
Step 2 - Establish the connection
- Install and configure the tool.
- Authenticate Salesforce access and set permissions.
Step 3 - Customize data access
Define the Salesforce objects and fields relevant for analysis, ensuring data is focused and actionable.
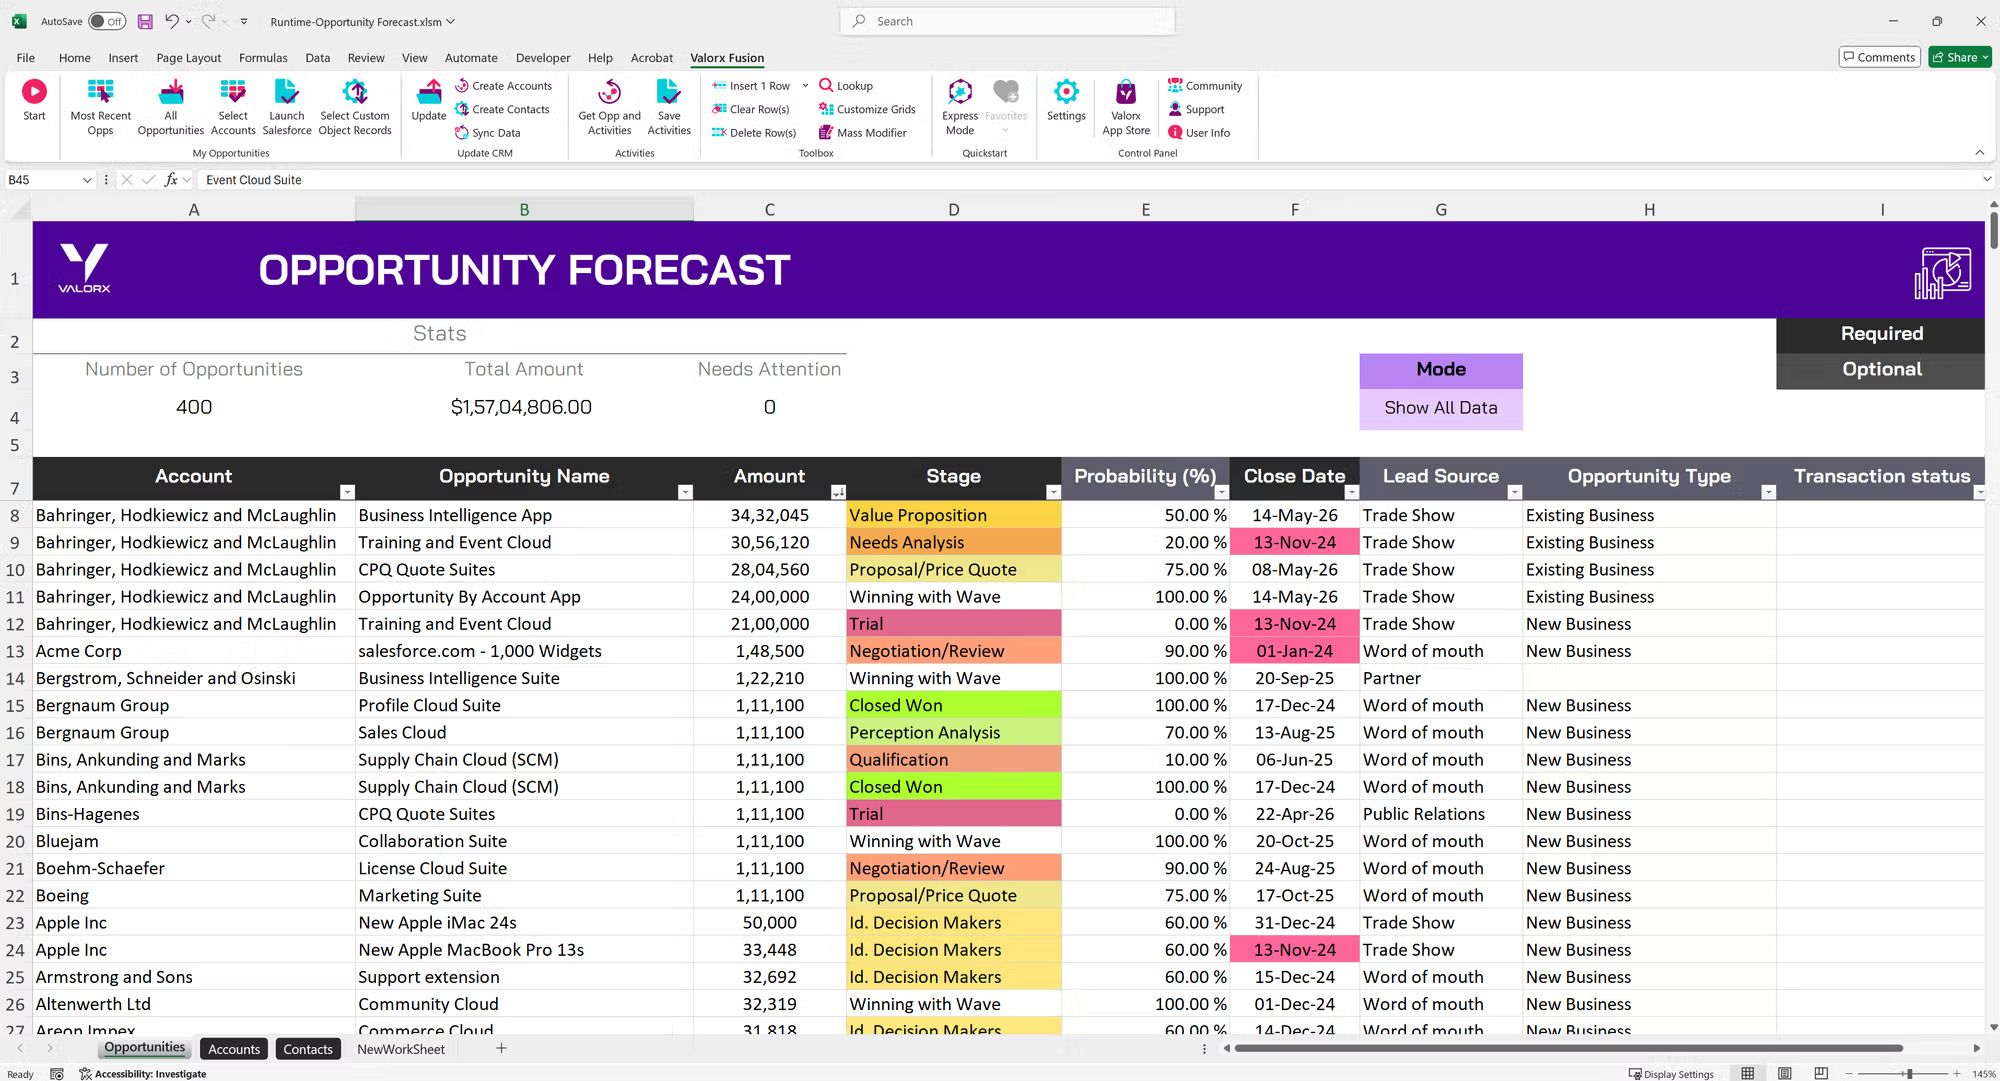
The above image shows Opportunity Forecasting in the Fusion interface where you select relevant objects such as Accounts, Opportunities etc. You can also identify specific fields for analysis within those objects.
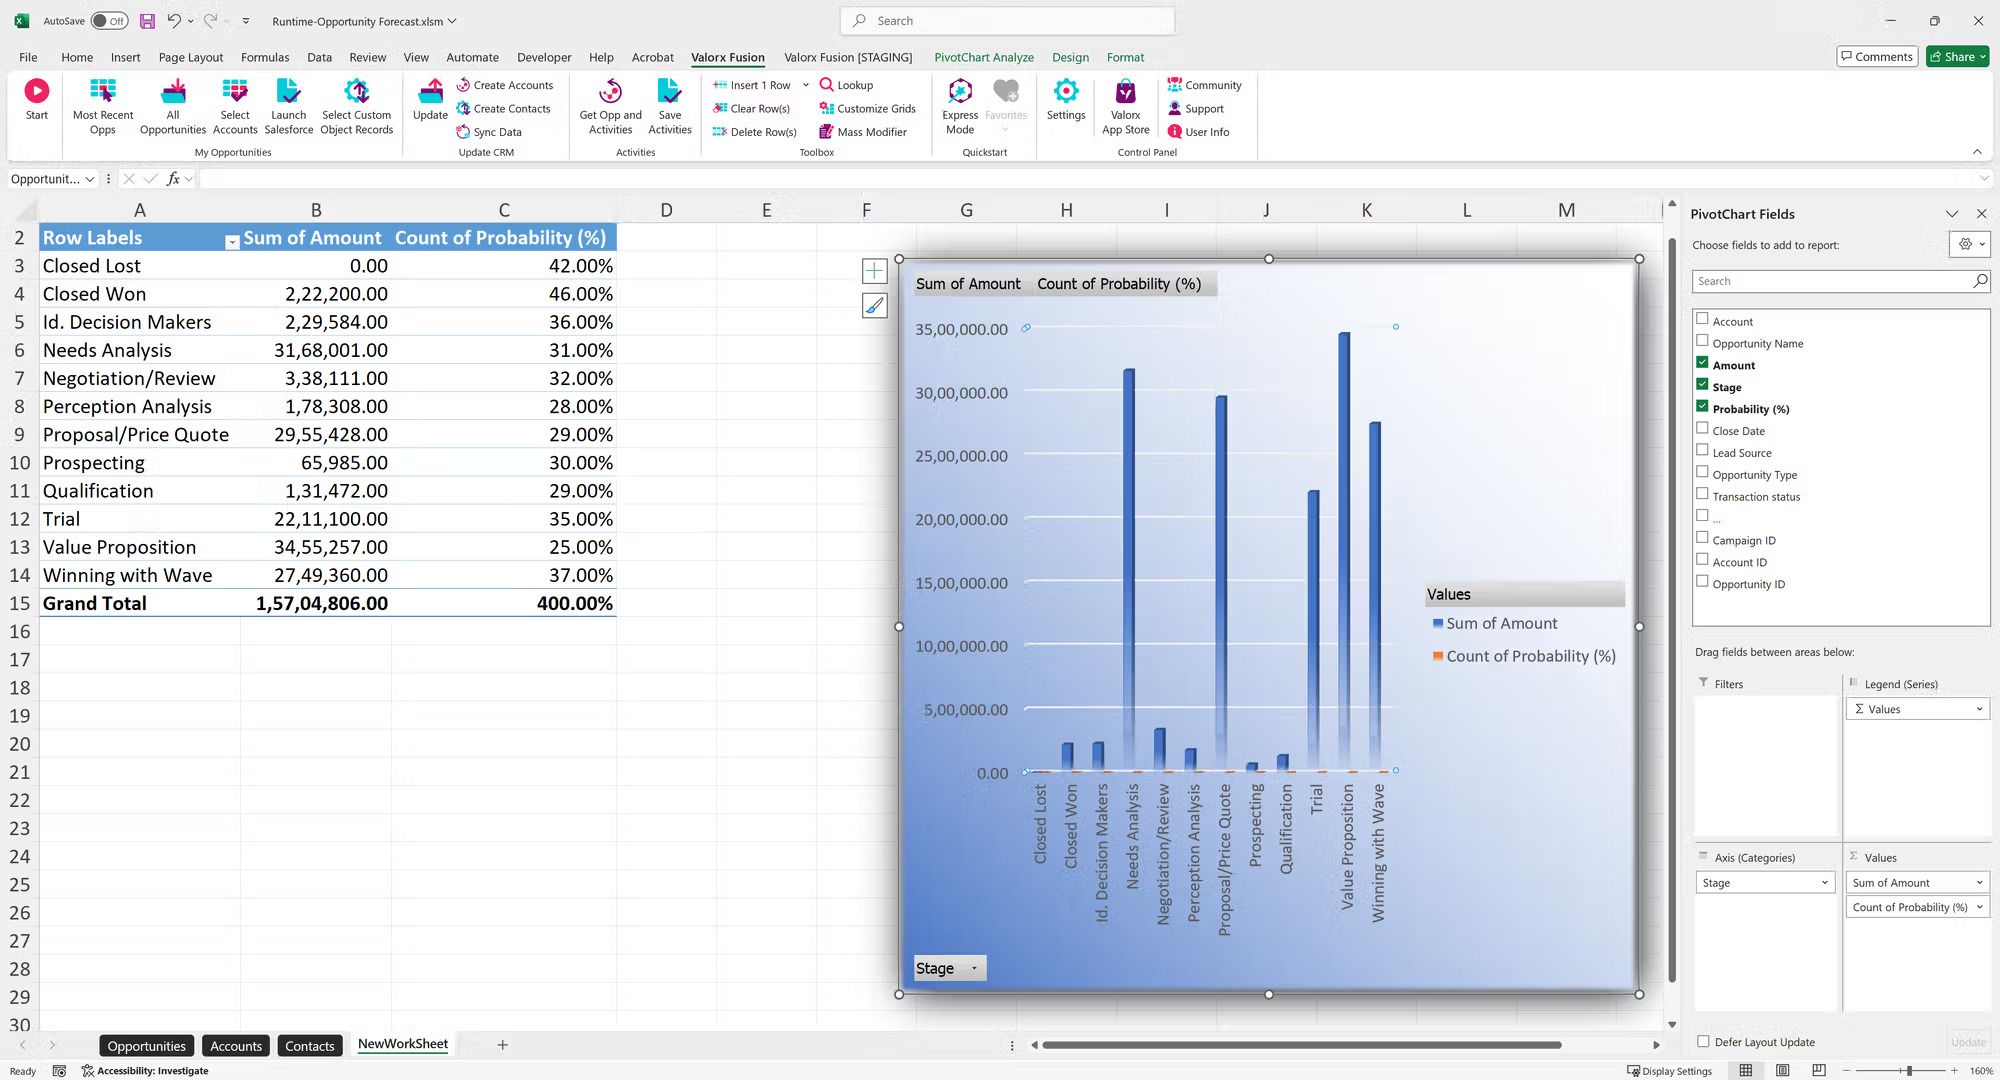
Step 4 - Create Pivot Tables in Excel
Import the configured Salesforce data into Excel to leverage Pivot Table functionality for deep insights.
Pro Tip: Opt for tools that respect Salesforce’s security protocols to ensure data integrity.
Boost Your Analytics with Excel Pivot Tables
By integrating Excel Pivot Tables with Salesforce, you gain access to tools that enable:
- Multi-dimensional analysis: Group and compare data by region, product, or customer segment.
- Custom calculations: Create fields to evaluate metrics like average deal size or profit margins.
- Forecasting: Visualize sales trends with Pivot Charts to plan strategically.
- Detailed insights: Drill down into Pivot Table data for granular analysis.
These applications demonstrate the potential of integrating Salesforce and Excel for advanced analytics. However, achieving this level of integration requires a robust tool that simplifies the process while ensuring security, accuracy, and efficiency.
Presenting The Ultimate Excel Salesforce Connector - Valorx Fusion
Valorx Fusion offers an intuitive solution for organizations seeking the most seamless way to integrate Salesforce and Excel. Designed specifically to bridge the gap between these platforms, it combines intuitive functionality with advanced features to deliver unparalleled analytics capabilities:
- Live data access: As mentioned earlier, you can analyze live Salesforce data in Excel without exporting.
- Bulk editing: Make changes to thousands of records in seconds.
- Data integrity: Sync updates back to Salesforce effortlessly.
- Advanced analytics: Leverage Excel’s features like Pivot Tables and calculated fields to gain deeper insights.
Take a look at how Valorx Fusion seamlessly integrates Excel and Salesforce.
A Gartner study suggests that bad data may cost companies up to 25% of their potential revenue. This gets worse: In that same Gartner survey, they found that 60% of companies don’t even measure these costs, meaning they have no idea how much GTM waste they’re generating while using this bad data.
Here’s where Salesforce Excel connectors like Valorx Fusion eliminate these inefficiencies.
Discover how BP Oil & Gas streamlined its quoting process with Fusion, reducing quote turnaround manifold while maintaining data accuracy and consistency.

Integrating Excel Pivot Tables with Salesforce transforms data management into a strategic advantage. It’s more than just convenience - it’s about empowering teams to work smarter, access real-time insights, and make data-driven decisions.
Whether you’re managing supply chains, analyzing customer trends, or forecasting sales, the combination of Salesforce and Excel offers unparalleled flexibility and power.
Ready to experience this difference?