
Demand Sensing vs. Demand Forecasting: What’s Right for Today’s Manufacturers?

Quick answer: Most manufacturers need both — forecasting for strategic planning, sensing for real-time agility. The real question: can your current process actually connect them? If demand planners are still exporting Salesforce data to Excel and reconciling manually, you're running a process built for 2015.
This guide breaks down when to use each approach, where most teams get stuck operationally, and how to close the gap.
Your forecast satisfies finance. But it's already wrong.
You spend weeks building a bottoms-up forecast — then watch it drift the moment a customer delays an order or a rep finally updates a stale opportunity.
Meanwhile:
- Operations plans production runs on numbers that are already outdated
- Procurement locks in contracts against a demand signal that shifted last Tuesday
- The quarter closes short, and everyone asks: why didn't we see this coming?
This is the core tension. You need long-range demand forecasts for capacity and procurement. You also need real-time visibility to adjust before small misses become big problems.
That's where forecasting and sensing come in. They're not competing approaches — they're complementary layers. The manufacturers who connect them well consistently outperform those who don't.
Where does your demand planning process actually stand?

Before diving into the mechanics of forecasting and sensing, it's worth asking a harder question: how mature is your current process?
Most manufacturers know they need better demand visibility. Fewer have honestly assessed where their process breaks down. Use this framework to identify where you are — and what's blocking the next level.
Level 1: Spreadsheet island
What it looks like: Demand planning lives in Excel. Data gets exported from Salesforce (or ERP) weekly or monthly, manipulated offline, and emailed around for input. Forecasts are point-in-time snapshots. By the time the "final" version is locked, half the inputs have already changed.
The pain you feel:
- Version control nightmares ("which file is current?")
- No real-time visibility into pipeline shifts
- Sales and demand planning working from different numbers
- Reconciliation eats days every cycle
What typically keeps teams here: Salesforce's native interface isn't built for bulk demand data operations. Updating hundreds of sales agreement line items or forecast rows one-by-one feels slower than just exporting to Excel.
Level 2: CRM-connected but clunky
What it looks like: Sales agreements, account forecasts, and pipeline data live in Salesforce — but actually working with that data is painful. Updates happen record-by-record. Running comparisons across accounts or time periods means building reports and still copying data out for analysis.
The pain you feel:
- Data is centralized but workflows aren't efficient
- Planners avoid Salesforce for heavy lifting
- Real-time data exists but accessing it in usable form takes too long
- Sensing signals (pipeline changes, run-rate shifts) are technically available but not actionable at speed
What typically keeps teams here: The CRM is configured correctly, but there's no productivity layer for demand planning workflows. Teams revert to spreadsheets for scenario modeling and bulk edits because Salesforce doesn't offer a grid-based, Excel-like experience.
Level 3: Connected and agile
What it looks like: Forecasting and sensing workflows operate on live CRM data without export/import cycles. Planners can bulk-edit sales agreements, update account forecasts across time periods, and compare planned vs. actual in a single view. Changes sync back to Salesforce in real time — keeping sales, ops, and finance aligned on the same numbers.
The pain you feel:
- Dramatically reduced (not eliminated)
- Scenario modeling is fast, not a weekend project
- Forecast cycles compress from weeks to days
- When a key account shifts, you see it in hours — not next month
What gets teams here: A productivity layer that connects spreadsheet-style workflows to live Salesforce data. This is exactly what Valorx Fusion enables — demand planners work in Excel, but every change syncs to Salesforce instantly.
See how Fusion brings live Salesforce connectivity into Excel, so demand planners can work in familiar spreadsheets without breaking Salesforce data accuracy.
Level 4: Predictive and proactive
What it looks like: AI-augmented demand sensing runs continuously. Automated alerts flag divergence between forecasts and real-time signals before they become problems. S&OP processes pull from a single source of truth with full scenario modeling capability. Continuous improvement loops refine forecast accuracy over time.
The pain you feel:
- Minimal — the system works with you
- Focus shifts from "getting the data right" to "making better decisions"
What gets teams here: Level 3 maturity is the foundation. You can't layer predictive sensing on top of disconnected spreadsheets. The data infrastructure and workflow efficiency have to be solved first.
Find out where your demand process actually stands
Reading about maturity levels is one thing. Knowing where your team sits — and what's specifically holding you back — is another.
This 2-minute assessment maps your current workflows against the maturity framework. No fluff, no email required to see results. Just honest signal on where to focus.
Where does your demand planning process stand?
Answer 6 quick questions to identify your maturity level and the gaps holding your team back.
Where do most manufacturing teams actually sit?
Honestly? Somewhere between Level 1 and Level 2. The tools exist to reach Level 3, but the gap between "data in Salesforce" and "data I can actually work with efficiently" keeps teams stuck in export/import cycles.
The rest of this guide breaks down the forecasting and sensing approaches — but keep your current maturity level in mind. The right methodology matters less than whether your process can actually execute it.
What is demand forecasting
Demand forecasting is the practice of predicting future customer demand using historical data, statistical models, and market analysis. It takes a long-range view — typically spanning weeks, months, or years — to drive decisions that can't be reversed quickly: production capacity, procurement commitments, capital investment, and headcount planning.
For manufacturers, this isn't optional. You can't build a factory based on last week's pipeline. You can't negotiate annual supplier contracts without a volume projection. And you can't tell the board what revenue to expect next year without a demand forecast underpinning the number.
The core questions demand forecasting answers:
- How many units should we produce next quarter — and do we have the capacity?
- Should we lock in raw material contracts now, or wait?
- Do we need to add a production line, a shift, or a facility?
- What does finance need to model for revenue, margin, and cash flow?
Long-term forecasts drive major capital decisions — whether to add a new production line or build a new factory — while short-term forecasts impact customer fulfillment, inventory levels, and financial health.
Frank Borovsky, Principal at B2Beyond and former leader at Honeywell, Ricoh, and Ingersoll Rand
Let's take a look on how actually demand forecasting works in manufacturing scenarios:
How Demand Forecasting Works
Historical Sales Analysis
Examines past sales data across product lines, regions, and time periods to identify baseline demand patterns.
Seasonal & Cyclical Adjustments
Accounts for recurring fluctuations — holiday peaks, end-of-quarter surges, industry-specific cycles.
Statistical & Predictive Models
Uses time-series analysis, regression models, and increasingly AI/ML algorithms to project future demand.
Market & Economic Signals
Incorporates macroeconomic indicators, industry trends, and competitive dynamics into longer-range projections.
Where demand forecasting breaks down
This is the part nobody puts in the methodology guide: forecasting works until it doesn't — and the failure modes are predictable.
- The data lag problem Your forecast is only as current as the inputs feeding it. If sales reps update opportunities sporadically, if sales agreements get revised offline and uploaded monthly, if customer conversations don't make it into the CRM until after the deal closes — you're forecasting based on a rearview mirror.
- The "one version of the truth" myth In theory, everyone works from the same forecast. In practice, sales has their number, finance has their number, and operations has the number they're actually planning against. The gaps between them only surface when someone misses.
- The false precision trap A forecast built in Excel with five decimal places still feels authoritative — even when the underlying assumptions are weeks out of date. The process creates confidence that the data doesn't support.
What this means practically: Forecasting methodology isn't usually the problem. Data freshness and workflow fragmentation are. Most manufacturers know how to forecast. Fewer have solved the operational challenge of keeping forecast inputs current without drowning in manual work.
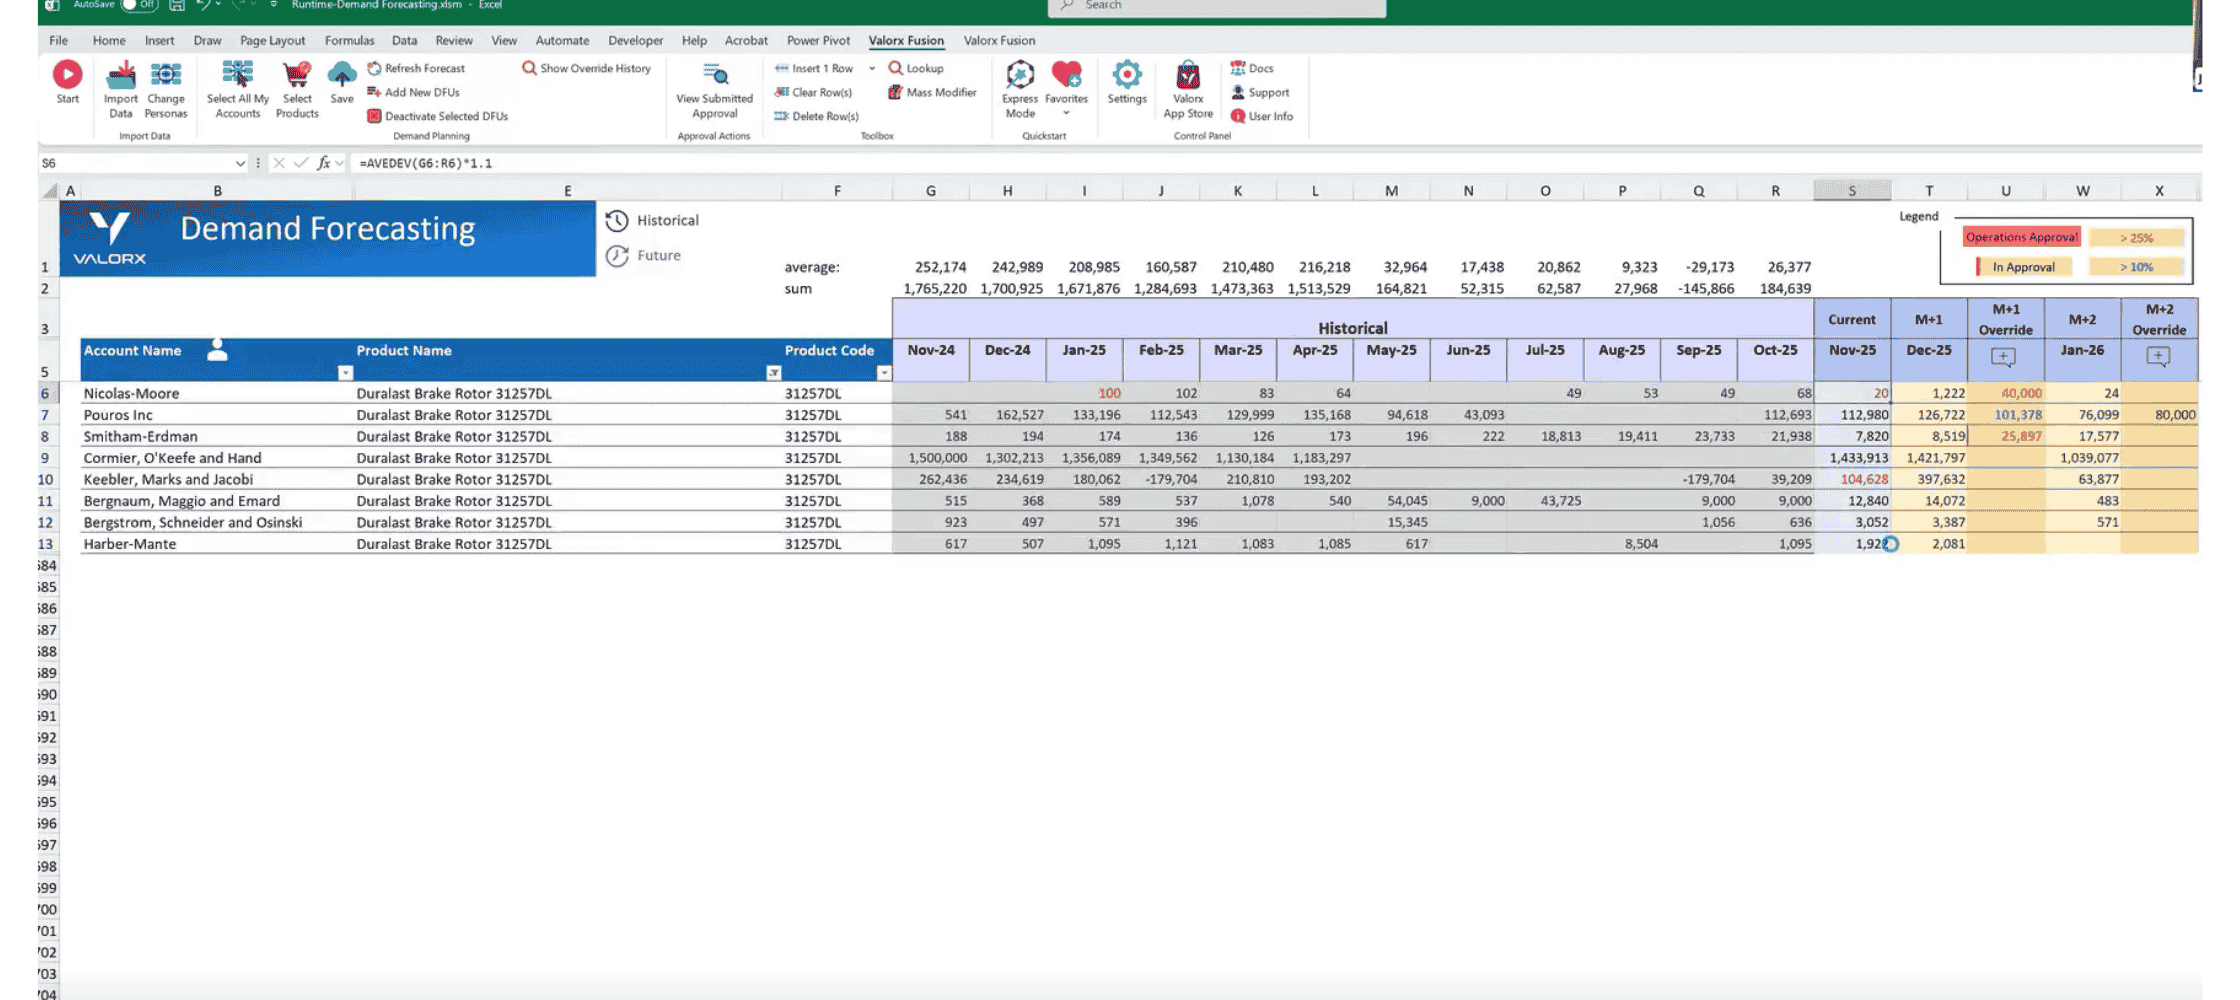
Deep planning at enterprise scale
Manage forecasts across dozens of accounts, products, and time periods — with familiar Excel workflows.

- 40+ accounts in a single view
- Historical vs. projected comparison
- Override columns for real-time adjustments
Best use cases for demand forecasting
Demand forecasting is your primary approach when decisions require long lead times and can't be easily reversed:
- Long production runs — Supplier lead times measured in weeks or months
- Annual planning — Budgets, revenue projections, headcount decisions
- Stable product lines — Inventory planning for predictable, mature SKUs
- Capacity investment — New equipment, facility expansion, contract manufacturing commitments
- Supply chain alignment — Long-term agreements with logistics partners and raw material suppliers
What is demand sensing
Demand sensing is the short-term correction layer that keeps your forecast from going stale. It uses real-time data — POS signals, pipeline changes, external market indicators — to detect shifts in demand as they happen, not weeks later when the variance report lands on someone's desk.
Where forecasting answers "what should we plan for?", sensing answers "what's actually happening right now — and how far off are we?"
Companies using demand sensing report 30-40% improvement in short-term forecast accuracy.
Gartner
Think of it this way: demand forecasting tells you where the river is headed over the next year. Demand sensing tells you about the rapids coming around the next bend — in time to adjust before you hit them.
The manufacturers who get this right don't choose between forecasting and sensing. They use forecasting to set the plan, and sensing to stay honest about how the plan is tracking.
Why demand sensing matters more now than five years ago
This isn't a new concept — but the urgency is new. Three shifts have made real-time demand visibility non-negotiable:
- Supply chain volatility is the new normal Post-2020, the assumption that supply chains are stable background infrastructure is gone. Supplier delays, logistics disruptions, and raw material shortages now happen with enough frequency that "wait and see" isn't a strategy. You need to see demand shifts early enough to adjust procurement and production before problems compound.
- Customer expectations have compressed B2B buyers increasingly expect B2C responsiveness. When a key account changes an order, they expect you to absorb the change — not explain why your planning cycle can't accommodate it. Sensing gives you the reaction time to meet those expectations without blowing up your operations.
- Forecast accuracy is under a microscope Finance, ops, and the board all want to know why the forecast missed. "The data was stale" is an explanation, not an excuse. Sensing capability is becoming table stakes for demand planning credibility.
How Demand Sensing Works
Real-Time Sales Data
Pulls from POS systems, e-commerce platforms, and CRM data to detect demand shifts as they emerge.
External Signal Monitoring
Incorporates weather data, social media trends, economic indicators, and competitor activity.
AI-Driven Pattern Recognition
Machine learning algorithms identify anomalies and emerging trends that traditional models miss.
Continuous Recalibration
Updates forecasts on daily or weekly cycles rather than monthly or quarterly.
Where demand sensing breaks down
Sensing sounds great in theory. In practice, most manufacturers struggle to operationalize it — and the failure modes are different from forecasting.
- The "real-time" data isn't actually real-time Sensing depends on fresh inputs. But if your CRM data only gets updated when reps have time, if sales agreements are revised in offline spreadsheets, if customer conversations live in email threads instead of opportunity records — your "real-time" signal is actually days or weeks old. Garbage in, garbage out.
- Signal vs. noise confusion Not every pipeline fluctuation is meaningful. Sensing systems that overreact to noise create as many problems as they solve — production schedules whipsawing, procurement orders getting revised daily, operations losing trust in the signal. The art is knowing which shifts matter and which are just volatility.
- No clear owner Forecasting usually has an owner: demand planning, finance, or sales ops. Sensing often falls into a gap. Is it a sales ops responsibility? A supply chain function? An analytics team deliverable? When sensing doesn't have a clear owner, it becomes a dashboard nobody acts on.
- The infrastructure isn't there You can't sense demand shifts if the data isn't flowing. For Salesforce Manufacturing Cloud users, this means opportunities, sales agreements, and account forecasts need to be current — and accessible in a format planners can actually work with. If accessing real-time pipeline data requires building a custom report, exporting it, and pivoting it in Excel, you've already lost the "real-time" advantage.
What this means practically: Demand sensing isn't primarily a technology problem. It's a workflow and data hygiene problem. The companies that do it well have solved two things: (1) data flows into the CRM quickly and consistently, and (2) planners can access and act on that data without friction.
Best use cases for demand sensing
Demand sensing earns its value when speed and adaptability matter more than long-range precision:
- Volatile demand patterns — Products where historical trends don't reliably predict short-term behavior
- Disruption response — Supplier delays, logistics bottlenecks, raw material shortages that require fast reallocation
- Short-term schedule optimization — Adjusting production runs weekly to reduce waste and avoid stockouts
- Promotion and pricing agility — Reading real-time market response and adjusting tactics mid-campaign
- Short lifecycle products — FMCG, electronics, seasonal goods where last year's data is less predictive
How demand sensing differs from demand forecasting
Demand Forecasting vs. Demand Sensing
| Dimension | Demand Forecasting | Demand Sensing |
|---|---|---|
| Time Horizon | Weeks to years | Days to weeks |
| Primary Data | Historical sales, seasonal trends, market analysis | Real-time POS, IoT, social media, weather, CRM signals |
| Update Frequency | Monthly or quarterly | Daily or weekly |
| Technology | Statistical models, time-series analysis, regression | AI/ML algorithms, real-time analytics, pattern recognition |
| Best For | Capacity planning, budgeting, procurement, strategic decisions | Short-term scheduling, disruption response, promotional adjustments |
| Risk Profile | Susceptible to black swan events and rapid market shifts | May overreact to noise; less useful for long-range strategic decisions |
| In Salesforce | Sales Agreements, Account-Based Forecasting, Collaborative Forecasts | Real-time opportunity and pipeline data, updated via Fusion or Wave |
How this works
Two tools, one connected workflow
Forecasting sets the plan. Sensing keeps it current.
Demand sensing vs. demand forecasting: Which approach is right for your manufacturing operation?
The short answer: you almost certainly need both. The real questions are (1) which approach should lead based on your context, and (2) whether your current process can actually execute either one well.
Accurate forecasting keeps operations smooth, while errors disrupt inventory, customer trust, and financial stability.
Frank Borovsky, B2Beyond
A quick diagnostic
Answer honestly — not how you'd like things to work, but how they actually work today:
| If this is true... | You're likely... |
|---|---|
| Biggest decisions need 3+ months lead time | Forecasting-led |
| Constantly adjusting schedules week-to-week | Sensing-led |
| Core product demand is stable year-over-year | Forecasting-led |
| Regular 20%+ swings that historical patterns miss | Sensing-led |
| Both columns apply? | Hybrid (and likely struggling to execute it) |
The real question: If a key customer changed their order volume yesterday, would it show up in your demand planning inputs today? If not, methodology doesn't matter — your data is the bottleneck.
You can have the right approach and still fail at execution if the data feeding your process is stale or fragmented.
Lead with demand forecasting if:
Your operation fits this profile:
- Long lead times are non-negotiable — Production cycles, supplier contracts, or capacity decisions that require months of advance planning
- Demand is relatively stable — Industrial equipment, aerospace, chemicals, or other sectors where historical patterns reliably predict future demand
- Capital decisions depend on volume projections — You're making investment decisions (equipment, facilities, headcount) based on demand forecasts
- Supply chain runs on long-term commitments — Annual contracts with raw material suppliers, contract manufacturers, or logistics partners
The risk: Forecasting-led models break down when market conditions shift faster than your planning cycle. If you're still working off last quarter's forecast when demand has already moved, you'll always be reacting late.
Lead with demand sensing if:
Your operation fits this profile:
- Demand is volatile or unpredictable — Fast-moving consumer goods, electronics, seasonal products, or anything where last year's patterns don't reliably predict next month
- External disruptions hit you hard — Weather, geopolitics, commodity prices, or supply chain shocks that require rapid reallocation
- Short-term optimization drives margin — Reducing waste, avoiding stockouts, and adjusting production schedules weekly or daily
- Pricing and promotions are dynamic — You need to read market response in real time and adjust tactics mid-flight
The risk: Sensing-led models can overreact to noise, creating whipsaw in production schedules and eroding operations' trust in the signal. Without a stable baseline from forecasting, you're constantly chasing the latest data point.
The hybrid model — and why it's harder than it sounds
Most manufacturers with any operational complexity need both: forecasting as the strategic baseline, sensing as the real-time adjustment layer.
In theory, this is straightforward:
- Use demand forecasting to set capacity plans, negotiate supplier contracts, and build annual budgets
- Use demand sensing to detect when actual demand diverges from plan and adjust short-term schedules accordingly
- Reconcile the two continuously so that sensing insights feed back into forecast refinement
In practice, this is where most teams get stuck.
Why hybrid execution breaks down:
| Challenge | What it looks like |
|---|---|
| Data lives in two places | Forecasts in one system (or spreadsheet), real-time pipeline data in Salesforce — and no clean way to compare them |
| Update cycles don't match | Forecasts update monthly; pipeline changes daily — by the time you reconcile, the gap is already a problem |
| Workflow friction | Planners can't efficiently update forecasts based on sensing signals because bulk edits in Salesforce are painful |
| No single source of truth | Sales has their view, demand planning has their view, finance has their view — and they only realize they're misaligned when the quarter misses |
This is the operational gap that determines whether hybrid actually works. The methodology is clear. The execution depends entirely on whether your tools let you connect forecasting and sensing workflows without friction.
Where Salesforce Manufacturing Cloud fits
Salesforce Manufacturing Cloud provides the data architecture for a hybrid model:
- Sales Agreements capture committed volumes — the long-range forecast baseline
- Account-Based Forecasting aggregates demand signals at the customer/product level — where sensing meets forecasting
- Run Rate Business tracks recurring revenue separately from net-new pipeline — giving planners a realistic baseline
The structure is right. The challenge is working with that data at the speed demand planning requires — which is where most teams hit a wall.
How Salesforce Manufacturing Cloud connects demand forecasting and demand sensing
Salesforce Manufacturing Cloud provides the data architecture for a unified demand planning process. The key isn't the features themselves — it's that forecasting inputs and real-time signals live in the same system, making the gap between "what we planned" and "what's actually happening" visible.
Three capabilities matter most:
Sales agreements — your forecasting baseline
Sales agreements capture what customers have committed to: volumes, pricing schedules, delivery timelines. This is the long-range forecast in its most concrete form — not a projection, but an agreement.
For demand planners, sales agreements are the anchor. The real value is tracking planned vs. actual over time:
- Customer consistently underperforming against agreement? Early warning signal.
- Customer overperforming? Opportunity to adjust production proactively — or renegotiate terms.
The catch: Sales agreements are only useful if they're current. When updates happen in offline spreadsheets and get uploaded monthly, you're planning against stale commitments.
Your forecasting baseline: View and edit sales agreement line items with planned quantities by month — directly in Salesforce. No exports, no version conflicts.
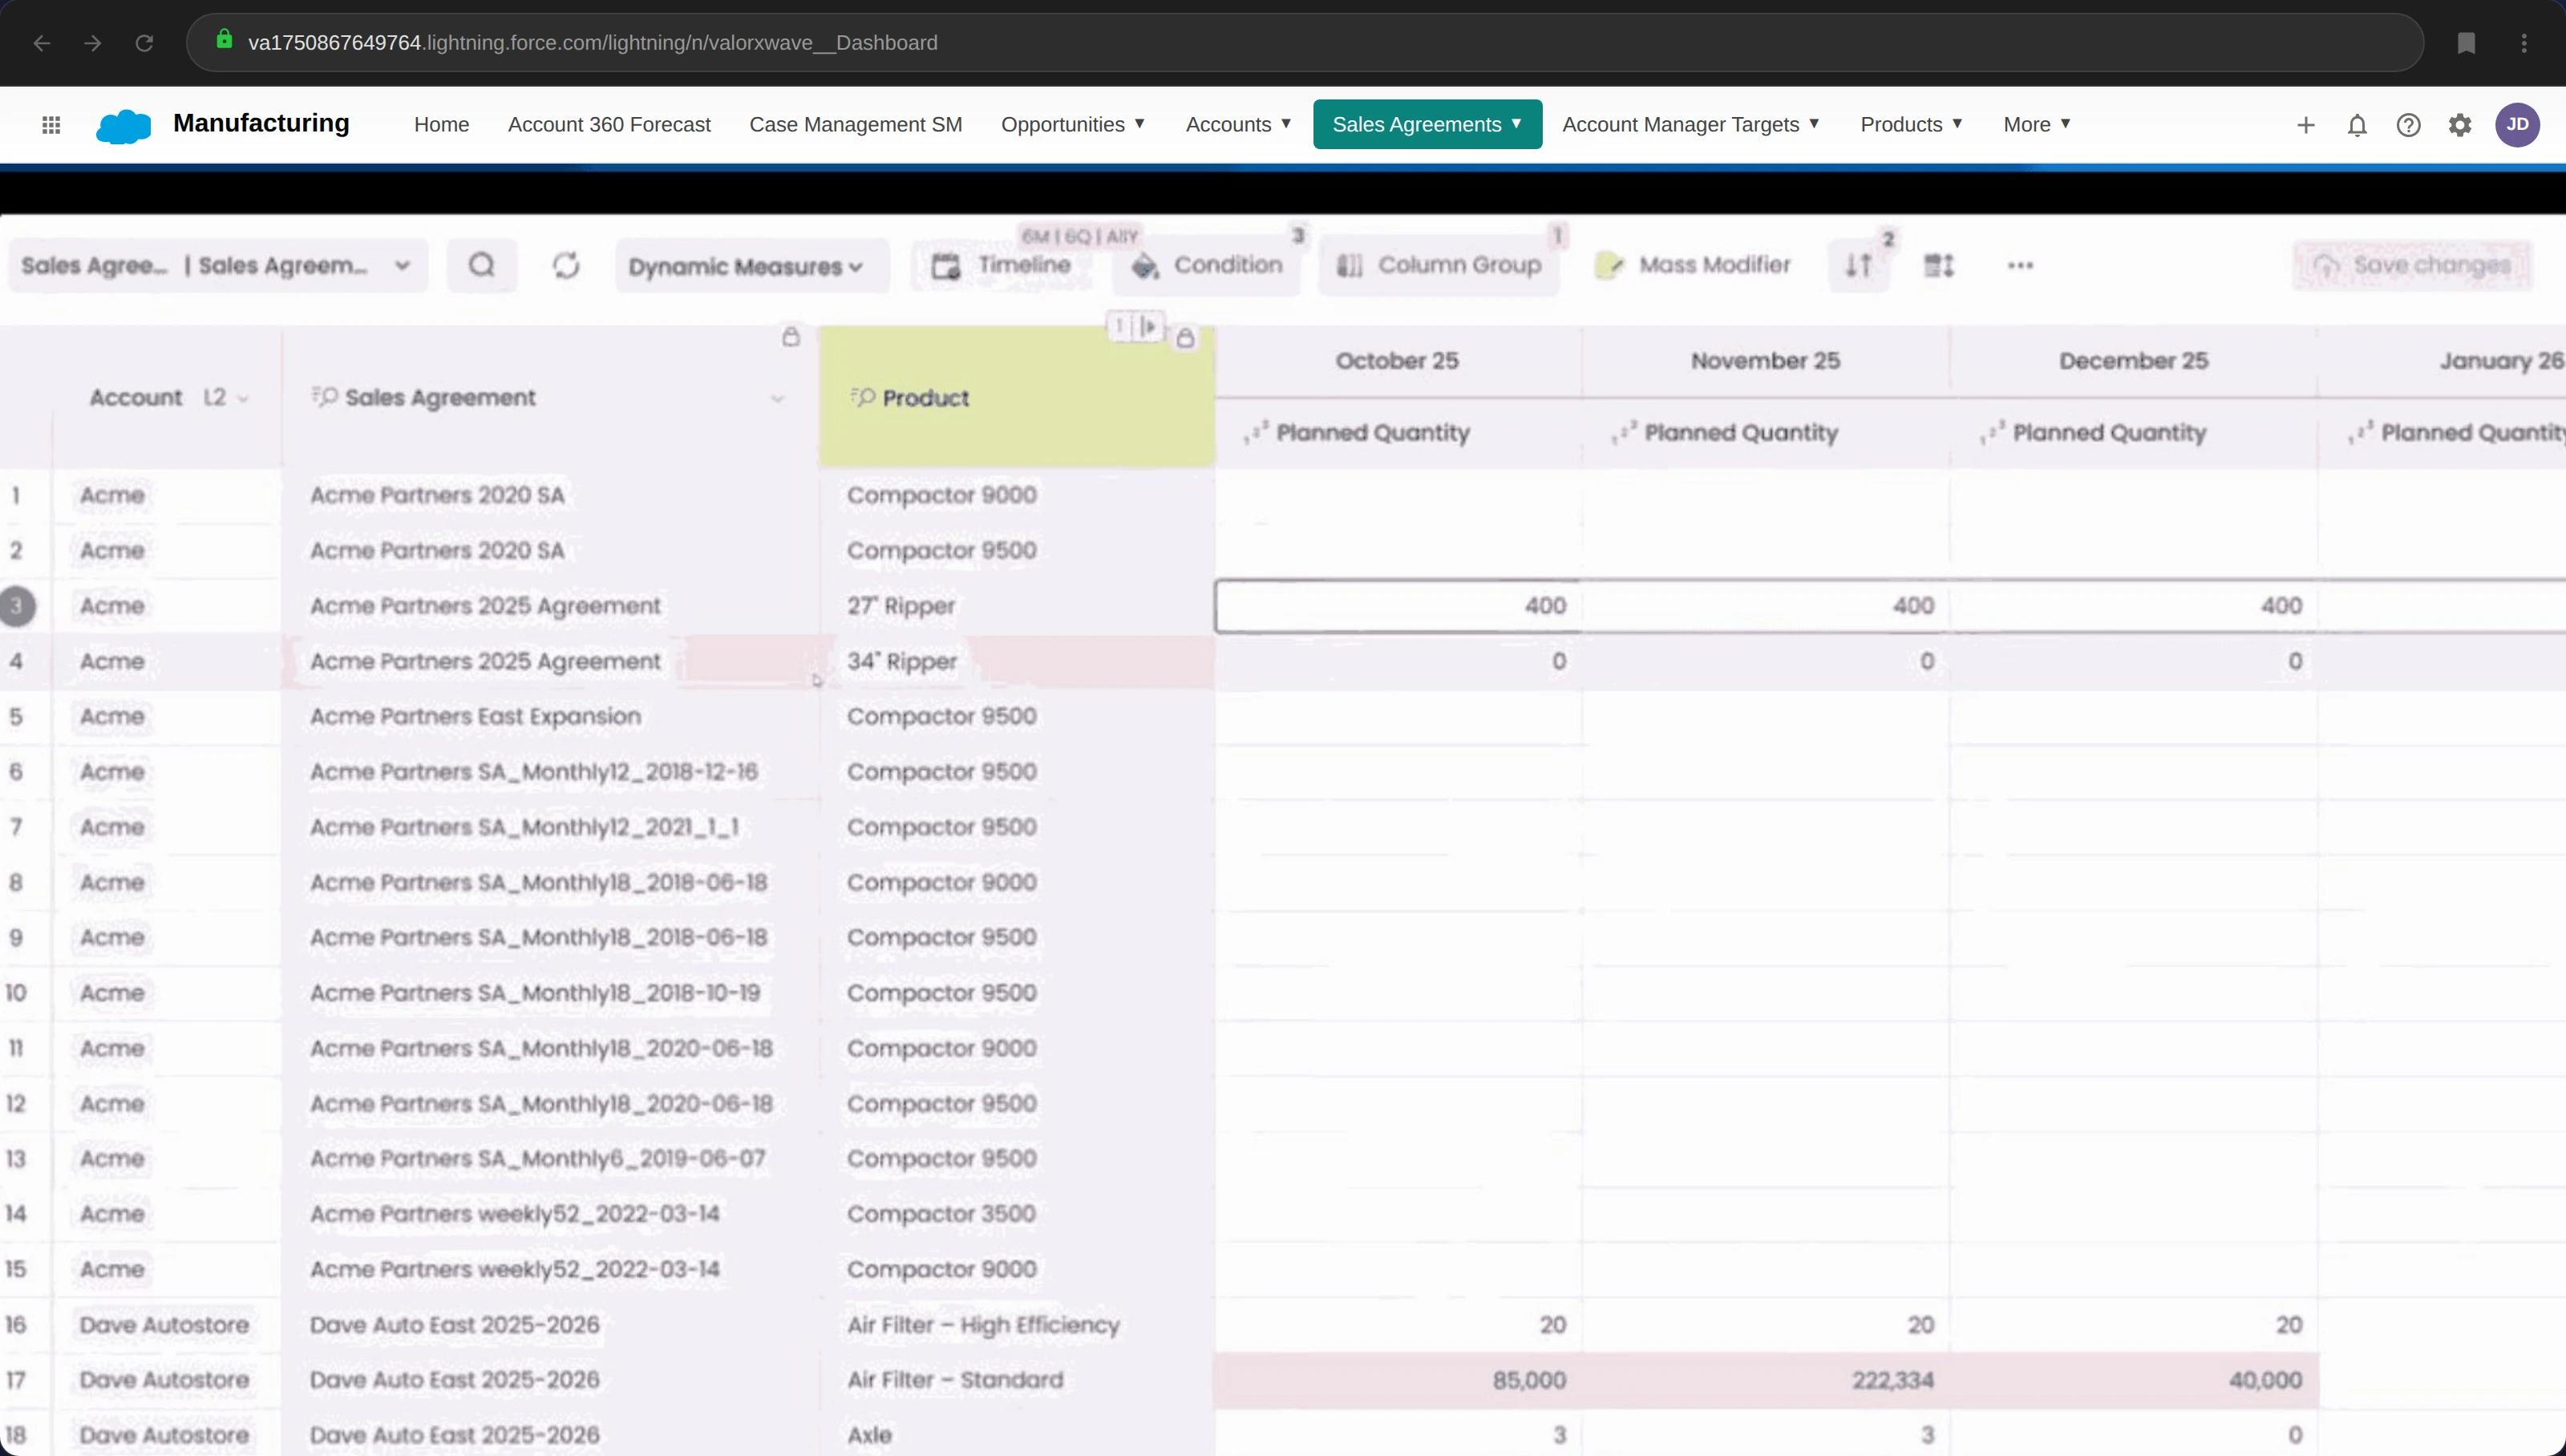
Account-based forecasting — where sensing meets planning
Standard Salesforce opportunity forecasting is deal-centric. Manufacturing Cloud's Account-Based Forecasting aggregates demand at the customer and product level — which is how manufacturing actually plans.
This is where the hybrid model comes to life:
- Long-term forecast by account and product family? That's your baseline.
- Sales rep updates their account forecast based on a customer conversation yesterday? That signal flows into the same view.
- The gap between forecast and latest signals becomes visible in one place.
The catch: This only works if the data is actually getting updated. If reps aren't maintaining account forecasts — or if planners can't efficiently compare forecast vs. actuals across dozens of accounts — the architecture exists but the workflow doesn't.
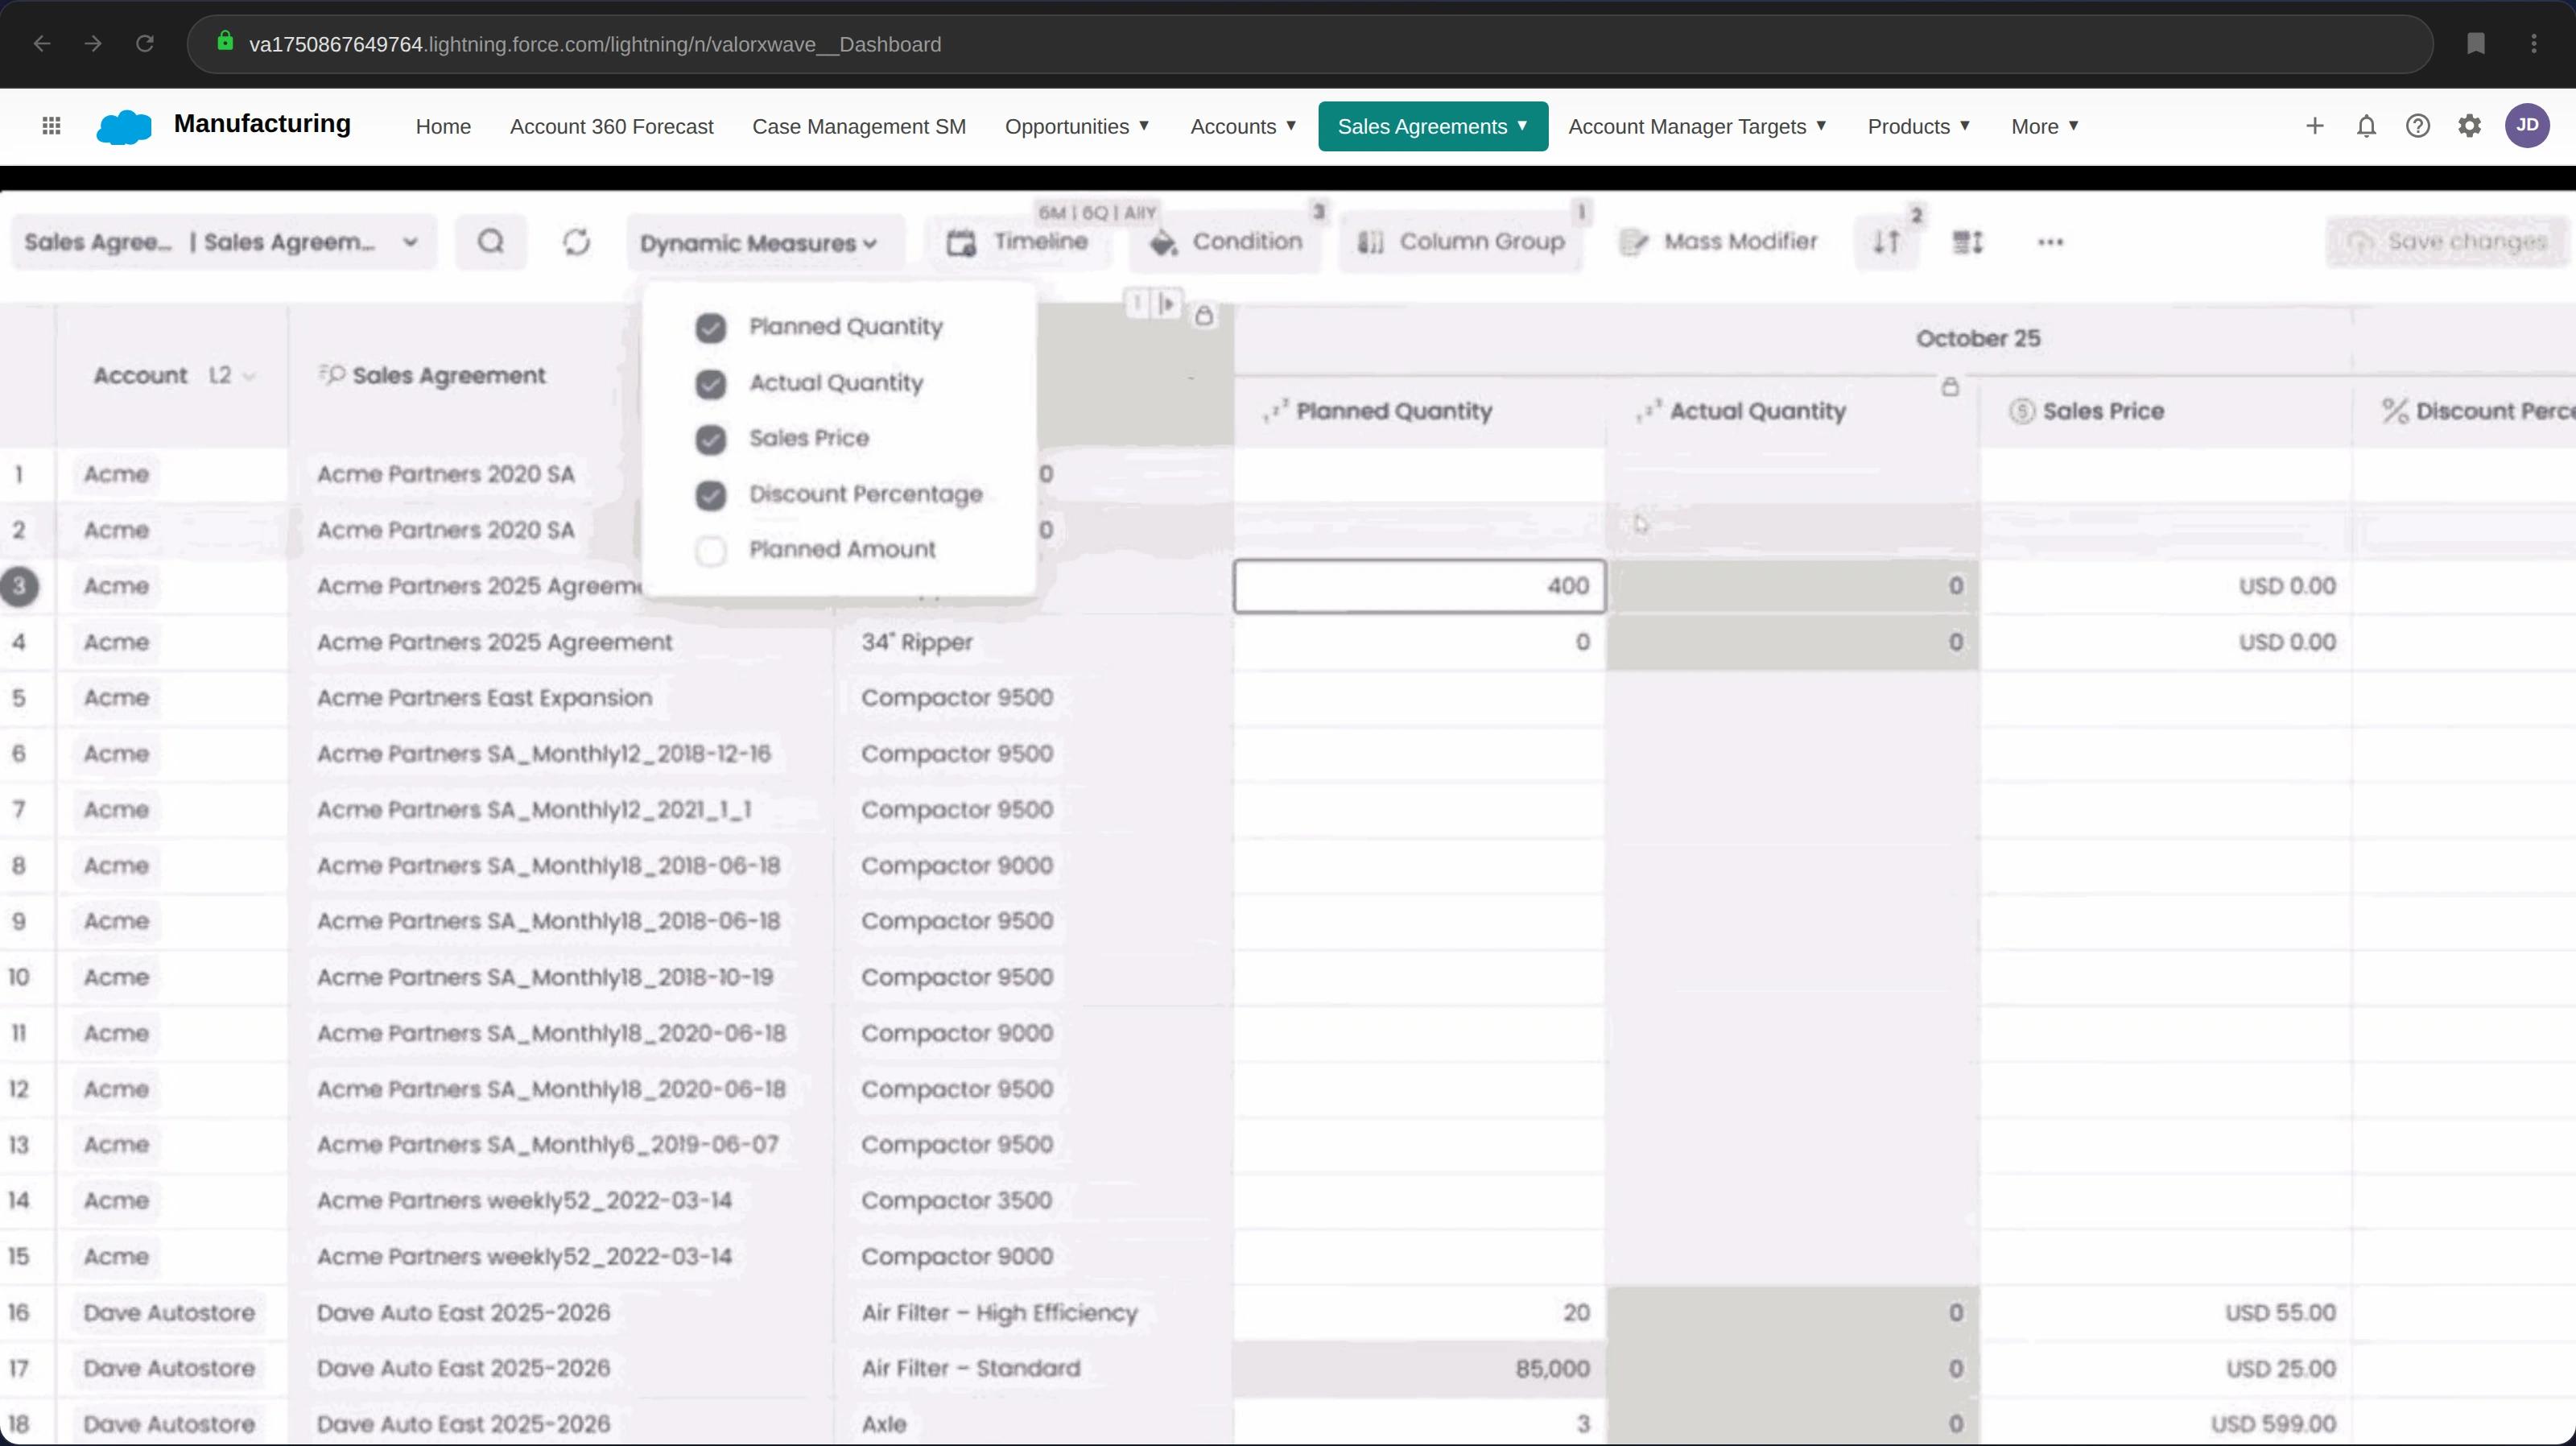
See what matters: Toggle between planned quantity, actual quantity, sales price, and discount percentage — on the fly. Compare planned vs. actual without switching reports.
Run rate business — the demand you already have
Most manufacturing revenue isn't "won" in the traditional CRM sense. It's recurring, repeat business — customers reordering based on existing agreements and relationships.
Manufacturing Cloud separates run-rate business from net-new pipeline. This matters because demand planners need a realistic baseline — not a view distorted by sales funnel stages designed for net-new deals.
The catch: Run rate tracking is only accurate if sales agreements and account forecasts reflect current reality. If the CRM is a quarter behind, so is your run rate view.
See it in action: S&OP in Salesforce Manufacturing Cloud
Joint webinar with TELUS Digital on how manufacturers are connecting demand planning workflows to Manufacturing Cloud, driving Salesforce adoption for S&OP — without the export/import cycle.
The pattern you'll notice
Each capability has the same caveat: the architecture is right, but execution depends on data freshness and workflow efficiency.
Salesforce Manufacturing Cloud gives you the structure. It doesn't solve the operational challenge of keeping that structure current — especially when demand planning workflows involve bulk updates across hundreds of records, scenario comparisons across time periods, and reconciliation between what's in Salesforce and what's in the spreadsheets planners actually use.
Siloed data leads to outdated, inaccurate forecasts, making informed decisions difficult.
That's the gap. And it's where most teams get stuck.
The real challenge: your tools don't match your workflow
Here's the uncomfortable truth: Salesforce Manufacturing Cloud provides the right data model — but Salesforce's native interface wasn't designed for how demand planners actually work.
Poor data quality costs the U.S. economy $3.1 trillion annually in slower productivity and higher operational costs.
Segment/IBM
That stat sounds abstract until you see it play out in a demand planning cycle.
What demand planning actually looks like
A demand planner's real workflow isn't clicking through CRM records one at a time. It's:
- Bulk operations at scale Updating hundreds of sales agreement line items across multiple accounts in a single session. Adjusting account-based forecasts across dozens of product-account combinations simultaneously. Changing time-period allocations across an entire product family.
- Comparison and reconciliation Pulling planned vs. actual quantities side-by-side across time periods. Comparing this quarter's forecast against last quarter's actuals and last year's same-quarter performance. Identifying which accounts are trending off-plan before the variance becomes a problem.
- Scenario modeling What happens to our production plan if Customer X reduces orders by 20%? If Supplier Y delays shipments by three weeks? If we shift volume from Plant A to Plant B? These aren't hypotheticals — they're Tuesday.
- Spreadsheet-native thinking Demand planners think in grids. Rows of products, columns of time periods, cells of quantities. Pivot tables, conditional formatting, formula-driven roll-ups. That's the mental model — and it's the interface they're fastest in.
Why teams end up back in Excel
Salesforce has the data. But when the interface doesn't match the workflow, planners do what's rational: they export.
- Export sales agreements to Excel
- Manipulate offline — bulk edits, scenario comparisons, reconciliation
- Email the file around for input from sales, finance, ops
- Re-import to Salesforce (eventually)
- Repeat next cycle
This works — until it doesn't.
- Version control breaks down. Which file is current? Who made changes? Are we all looking at the same numbers?
- Data goes stale. The moment you export, your spreadsheet starts drifting from reality. Pipeline changes, agreements get revised, opportunities close — and your offline file doesn't know.
- Sensing becomes impossible. You can't sense demand shifts in real time when your working data is a snapshot from last week's export.
- The CRM becomes a system of record, not a system of work. Data gets uploaded for compliance and reporting, but the actual planning happens elsewhere. Sales, ops, and finance end up working from different numbers — and only discover the gap when the quarter misses.
Demand planning teams often distrust sales data, leading to misaligned forecasts. A unified process is essential.
Mark Schmidt, Senior Director at Salesforce
The gap isn't methodology. It's workflow.
Go back to the maturity model from earlier:
- Level 1 teams know they have a spreadsheet problem but don't see a way out.
- Level 2 teams have the data in Salesforce but can't work with it efficiently — so they end up exporting anyway.
- Level 3 teams have solved this: they work with live Salesforce data in a spreadsheet interface, with changes syncing back in real time.
The difference between Level 2 and Level 3 isn't strategy. It's having a productivity layer that connects how planners work (spreadsheets) with where the data lives (Salesforce).
That's the gap Valorx Fusion closes.
Closing the gap: live Salesforce data, spreadsheet workflow
The disconnect is clear: Salesforce Manufacturing Cloud has the right data model, but demand planners work in spreadsheets — and the export/import cycle breaks everything that makes real-time demand planning possible.
Valorx Fusion eliminates that disconnect. Planners work in Excel, but the data is live Salesforce data. Every edit syncs back in real time. No export. No version control problems. No drift between what's in your spreadsheet and what's in the CRM.
This isn't about replacing how demand planners work. It's about connecting how they already work to the system of record.
Rolling forecasts across quarters
Multi-period planning with sales agreements and opportunities — all in Excel, all connected to Salesforce.
- Quarterly rolling view (Q1 '25 – Q4 '27)
- Sales agreements + opportunities combined
- Category breakdowns (semiconductor, storage)
What this looks like in practice
Forecasting workflows — at the speed planners actually need
| The old way | With Fusion |
|---|---|
| Click into each sales agreement record individually to update line items | Bulk-edit hundreds of sales agreement line items across multiple accounts in a single Excel session |
| Build a report, export it, pivot it in Excel to compare planned vs. actual | View planned vs. actual across time periods in a familiar grid — with live data |
| Run scenarios offline, then manually re-key changes into Salesforce | Adjust forecast numbers in Excel, see downstream impact, commit changes when ready — all synced |
Sensing workflows — real-time signal, real-time action
| The old way | With Fusion |
|---|---|
| Export pipeline data weekly, analyze alongside stale forecast snapshot | Pull real-time pipeline and opportunity data into Excel alongside live forecast data |
| Identify a demand shift, then wait for the next planning cycle to adjust | Update short-term forecast adjustments and push them back to Salesforce instantly |
| Toggle between reports, spreadsheets, and CRM screens to piece together the picture | Combine run-rate data, pipeline signals, and forecast commitments in a single spreadsheet view |
What changes for demand planning teams
- Forecast cycles compress. When bulk updates that took days now take hours, and reconciliation happens in real time instead of at month-end, the entire planning cycle accelerates. Teams using Fusion report moving from monthly forecast updates to weekly — without adding headcount.
- Data trust goes up. When planners work directly in Salesforce data (not a copy of it), the "which version is right?" problem disappears. Sales, finance, and ops work from the same numbers — because there's only one set of numbers.
- Sensing becomes actually possible. You can't sense demand shifts in real time if your workflow involves weekly exports. With live data in Excel, planners can see pipeline changes as they happen and adjust forecasts before the variance becomes a problem.
- The CRM becomes a system of work, not just a system of record. Data doesn't get uploaded for compliance after the fact. It gets worked with, in real time, by the people who need to act on it.
Proof point: Semiconductor manufacturer unifies demand planning
A leading semiconductor manufacturer was running demand planning across fragmented spreadsheets — each region maintaining their own forecasts, reconciliation happening quarterly, and forecast accuracy suffering as a result.
After implementing Fusion:
- Sales agreement and account forecast data consolidated in a single, live-connected workflow
- Regional teams working from the same data in real time
- Forecast accuracy improved as planners could detect and respond to demand shifts faster
- Planning cycles shortened from quarterly reconciliation to continuous alignment
Where Fusion fits in the maturity model
Remember the maturity levels from earlier?
| Level | Description | Fusion's role |
|---|---|---|
| Level 1 | Spreadsheet island | Fusion connects existing spreadsheet workflows to live Salesforce data — eliminating export/import cycles |
| Level 2 | CRM-connected but clunky | Fusion adds the productivity layer that makes working with Salesforce data efficient — bulk edits, grid views, scenario modeling |
| Level 3 | Connected and agile | Fusion is how teams get here — and stay here |
| Level 4 | Predictive and proactive | Fusion provides the workflow foundation that makes advanced sensing and AI-augmented planning possible |
You don't need to transform your process overnight. Fusion meets planners where they are — in Excel — and connects that workflow to where the data needs to live.
Ready to connect your demand planning workflow?
Stop the export/import cycle. See Fusion working with live Manufacturing Cloud data.No slides, no pitch deck — just the product.
Frequently asked questions
Can demand sensing replace demand forecasting?
No. Demand sensing is designed to complement forecasting, not replace it. Forecasting provides the strategic baseline for capacity planning and procurement. Sensing adjusts that baseline in real time based on current market signals. Without forecasting, you lose the long-range view needed for capital investment decisions. Without sensing, you can't react to short-term disruptions.
How does Salesforce Manufacturing Cloud support demand planning?
Manufacturing Cloud provides three core capabilities for demand planning: Sales Agreements (which track committed volumes and delivery schedules), Account-Based Forecasting (which aggregates demand at the customer/product level), and Run Rate Business tracking (which separates recurring revenue from net-new pipeline). Together, these create a unified data model for both long-term forecasting and short-term demand adjustments.
What tools do manufacturers use for demand planning in Salesforce?
Salesforce provides native Manufacturing Cloud features, but most teams need a productivity layer on top for bulk data operations. Valorx Fusion connects Excel to live Salesforce data, enabling demand planners to update forecasts, edit Sales Agreements, and run scenarios in the spreadsheet interface they already know — while keeping everything synced to Salesforce in real time.
What's the difference between demand planning and demand forecasting?
Demand forecasting is a component of demand planning. Demand planning is the broader process that includes forecasting, inventory optimization, supply planning, and S&OP alignment. Forecasting generates the demand prediction; planning turns that prediction into operational decisions.
Do I need Valorx Fusion or Valorx Wave for demand planning in Salesforce?
It depends on where your team works. Fusion is built for demand planners, finance teams, and sales ops who do heavy analysis in Excel — bulk forecast updates, scenario modeling, and cross-account comparisons with live Salesforce data. Wave is built for sales reps and managers who need to update account forecasts, pipeline data, and Sales Agreement details directly inside Salesforce using an inline grid editor. Many manufacturing teams use both: Wave keeps real-time sales signals accurate at the source, and Fusion gives planners the spreadsheet-powered analysis layer to turn those signals into decisions.